Continuous Degradation Detection (CODED)
Continuous Degradation Detection (CODED) is a forest monitoring application developed for mapping and statistically estimating the areas of forests affected by forest degradation. CODED is open source and can run on the Google Earth Engine. CODED can be used to monitor and estimate forest degradation and deforestation. For an overview of the CODED methodology please refer to Bullock et al., (2020).
Background
Background and Motivation
CODED is an algorithm developed to monitor for forest conversion and degradation using time series analysis of Landsat data. The algorithm is based upon previous developments in continuous land cover monitoring [1] and tropical degradation mapping using spectral unmixing models [2] and is built upon the Google Earth Engine processing and data storage system. The algorithm was originally implemented in Python but required large data storage and computing resources for processing the vast amounts of data. Therefore, CODED was ported to the Javascript language for easier use over large areas.
The motivation behind the CODED project was to develop a methodology that could successfully identify low-magnitude forest disturbances in addition to differentiate between deforestation and degradation. While recent scientific and technological advances have greatly improved our ability to map high-magnitude forest clearings [3], no such methodology has proven as reliable for identifying degradation [4]. Despite this, degradation has been estimated to account for 40-212% the carbon emissions of deforestation [5-7]. Degradation events can often be small, subtle, and temporary, making them tricky to identifying with traditional approaches to change detection [8]. CODED attempts to overcome some of these limitations through sub-pixel spectral mixture analysis performed continuously through time. Timeseries analysis allows for subtle changes to be differentiated from ephemeral variations due to clouds or cloud shadows. Multi-temporal information is then used for land cover classification. The result is an approach that has proven successful at being able to differentiate disturbances that do not result in a change in land cover, or degradation, from forest conversion.
While CODED is able to produce disturbance maps that can be used for a variety of purposes, the subtle and temporary nature of degradation events means that errors of omission can potentially be large. Therefore, CODED has been shown to be most successful in the past for stratifying a landscape, which can then be used to derive sample-based estimates of area of degradation.
| [1] | Zhu, Z., & Woodcock, C. E. (2014). Continuous change detection and classification of land cover using all available Landsat data. Remote sensing of Environment, 144, 152-171. |
| [2] | Souza Jr, C., Firestone, L., Silva, L. M., & Roberts, D. (2003). Mapping forest degradation in the Eastern Amazon from SPOT 4 through spectral mixture models. Remote sensing of environment, 87(4), 494-506. |
| [3] | Hansen, M.C., Potapov, P. V, Moore, R., Hancher, M., Turubanova, S. a, Tyukavina, a, Thau, D., Stehman, S. V, Goetz, S.J., Loveland, T.R., Kommareddy, a, Egorov, a, Chini, L., Justice, C.O., Townshend, J.R.G., 2013. High-resolution global maps of 21st-century forest cover change. Science 342, 850–3. doi:10.1126/science.1244693 |
| [4] | Herold, M., Román-Cuesta, R., Mollicone, D., Hirata, Y., Van Laake, P., Asner, G.P., Souza, C., Skutsch, M., Avitabile, V., MacDicken, K., 2011b. Options for monitoring and estimating historical carbon emissions from forest degradation in the context of REDD+. Carbon Balance Manag. 6, 13. doi:10.1186/1750-0680-6-13 |
| [5] | Berenguer, E., Ferreira, J., Gardner, T.A., Aragão, L.E.O.C., De Camargo, P.B., Cerri, C.E., Durigan, M., De Oliveira, R.C., Vieira, I.C.G., Barlow, J., 2014. A large-scale field assessment of carbon stocks in human-modified tropical forests. Glob. Chang. Biol. 20, 3713–3726. doi:10.1111/gcb.12627 |
| [6] | Pearson, T.R.H., Brown, S., Murray, L., Sidman, G., 2017. Greenhouse gas emissions from tropical forest degradation: an underestimated source. Carbon Balance Manag. 12, 3. doi:10.1186/s13021-017-0072-2 |
| [7] | Baccini, A., Walker, W., Carvahlo, L., Farina, M., Sulla-Menashe, D., Houghton, R., 2017. Tropical forests are a net carbon source based on new measurements of gain and loss. Rev. 5962, 1–11. doi:10.1126/science.1252826 |
| [8] | Goetz, S.J., Baccini, A., Laporte, N.T., Johns, T., Walker, W., Kellndorfer, J., Houghton, R.A., Sun, M., 2009. Mapping and monitoring carbon stocks with satellite observations: a comparison of methods. Carbon Balance Manag. 4, 2. doi:10.1186/1750-0680-4-2 |
Definitions
Definitions related to monitoring forest disturbances.
- Deforestation
- Food and Agriculture Organization of the United Nations (FAO) through the United Nations Framework Convention on Climate Change (2001) [1] describe deforestation as “the direct human-induced conversion of forested land to non-forested land”.
- Forest conversion
- Any disturbance, natural or anthropogenic, that results in a conversion from forest to another land cover. This includes deforestation and a natural conversion such as permanent waterlogging.
- Degradation
- There is no internationally accepted definition of degradation. We define degradation as “any forest disturbance, natural or anthropogenic, which does not result in a land cover change”. The disturbance can cause a change in land use, for example a primary forest turning into a managed forest or partially harvested, but as long as the land cover definition remains forest the event is considered degradation.
- Forest
- We define a forest as any land that contains over 20% canopy cover of trees over 5 meters in height, not being primarily used by urban or agricultural land uses, including natural or non-natural openings, and includes tree plantations.
- Forest Disturbance
- Any short or long term event that causes destructive damage to a forest. The event can be human caused or natural. The event must have a start and end time, in contrast to trend (such as long term greening or species succession due to climate change).
- Secondary Forest:
- The FAO (2003) [2] defines secondary forests as “forests regenerating largely through natural processes after significant removal or disturbance of the original forest vegetation by human or natural causes at a single point in time or over an extended period.”
| [1] | FAO, 2015. Forest Resources Assessment 2015: Terms and Definitions, FAO report. |
| [2] | FAO, 2003. Tropical Secondary Forest Management in Africa:, in: Proceedings on Workshop on Tropical Secondary Forest Management in Africa: Reality and Perspectives. Nairobi, Kenya. |
Algorithm Description
Data
CODED was designed to use 30m Landsat data. Before running the algorithm, it is necessary that a multi-dimentional data stack be created. The data stack contains all available Landsat data or, in the Earth Engine implementation, monthly composited data.

Pre-processing
All available Landsat data is used a converted to surface reflectance using the standard LEDAPS surface reflectance product. The data is first filtered for clouds using CFMask.
The data are then converted through linear spectral unmixing to represent fractions of spectral endmembers developed in Souza et al., 2005, in addition to a self-developed cloud endmember. The 5 endmembers are:
- Green Vegetation
- Non-Photosynthetic Vegetation
- Shade
- Soil
- Cloud
The endmembers are transformed according to the methodology in Souza et al (2005) in to the Normalized Fraction Degradation Index (NDFI). NDFI is generally designed to highlight areas of degraded or cleared forests. NDFI was originally designed for forest monitoring in the Amazon.

Forest classification and characterization
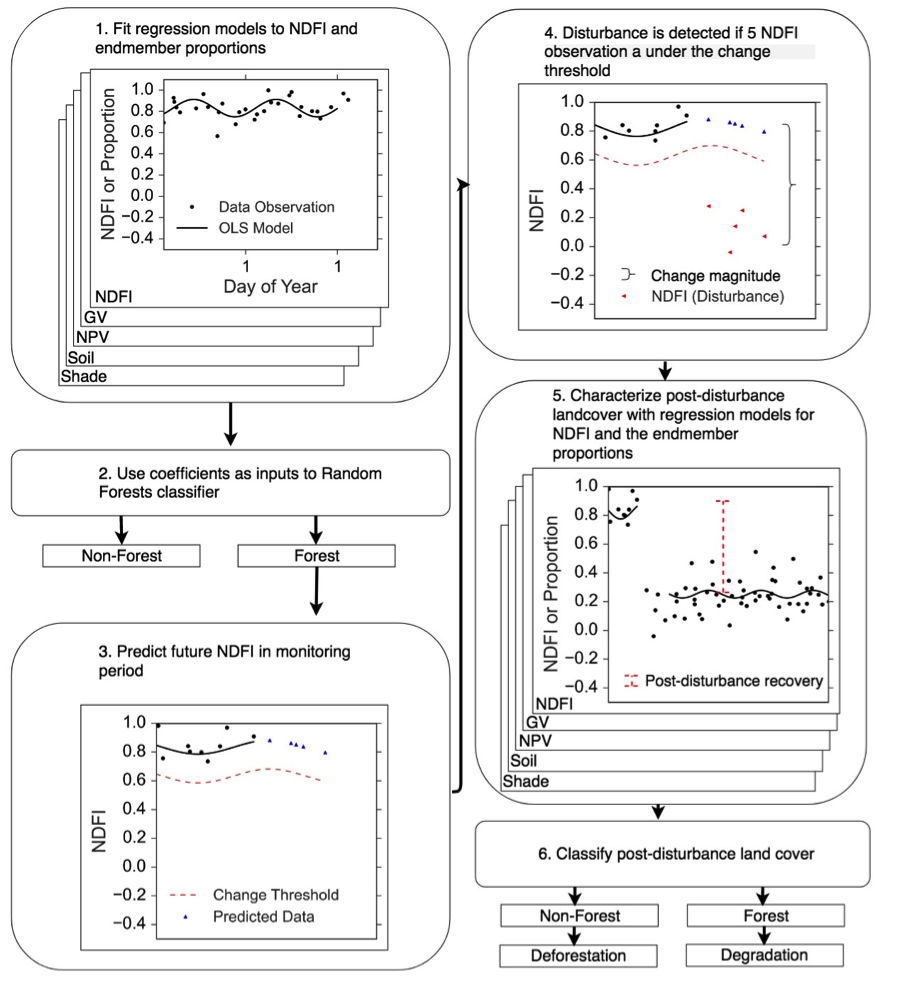
To find degraded or damaged forests, the original state of the forest must first be characterized. Generally, an NDFI value near or at 1 is indication of a forested landscape. However, the magnitude of NDFI will depend on the density of the forest. A training period is used to define the ‘general’ state of the forest. To account for clouds, sensor noise, and other factors that cause image-to-image variability, a regression model is fit for every pixel for all the observations in the training period. The regression model is made up of the following components:
- A constant term, representing overall magnitude
- A sine and cosine term, representing seasonal, or intra-annual variability
- A noise term, summarized in the algorithm as the root-mean-squared-error
These regression components are used to differentiate a forest from other land covers. The following chart shows how the land covers differ based on regression RMSE and magnitude based on 1250 training locations across the Amazon basin:
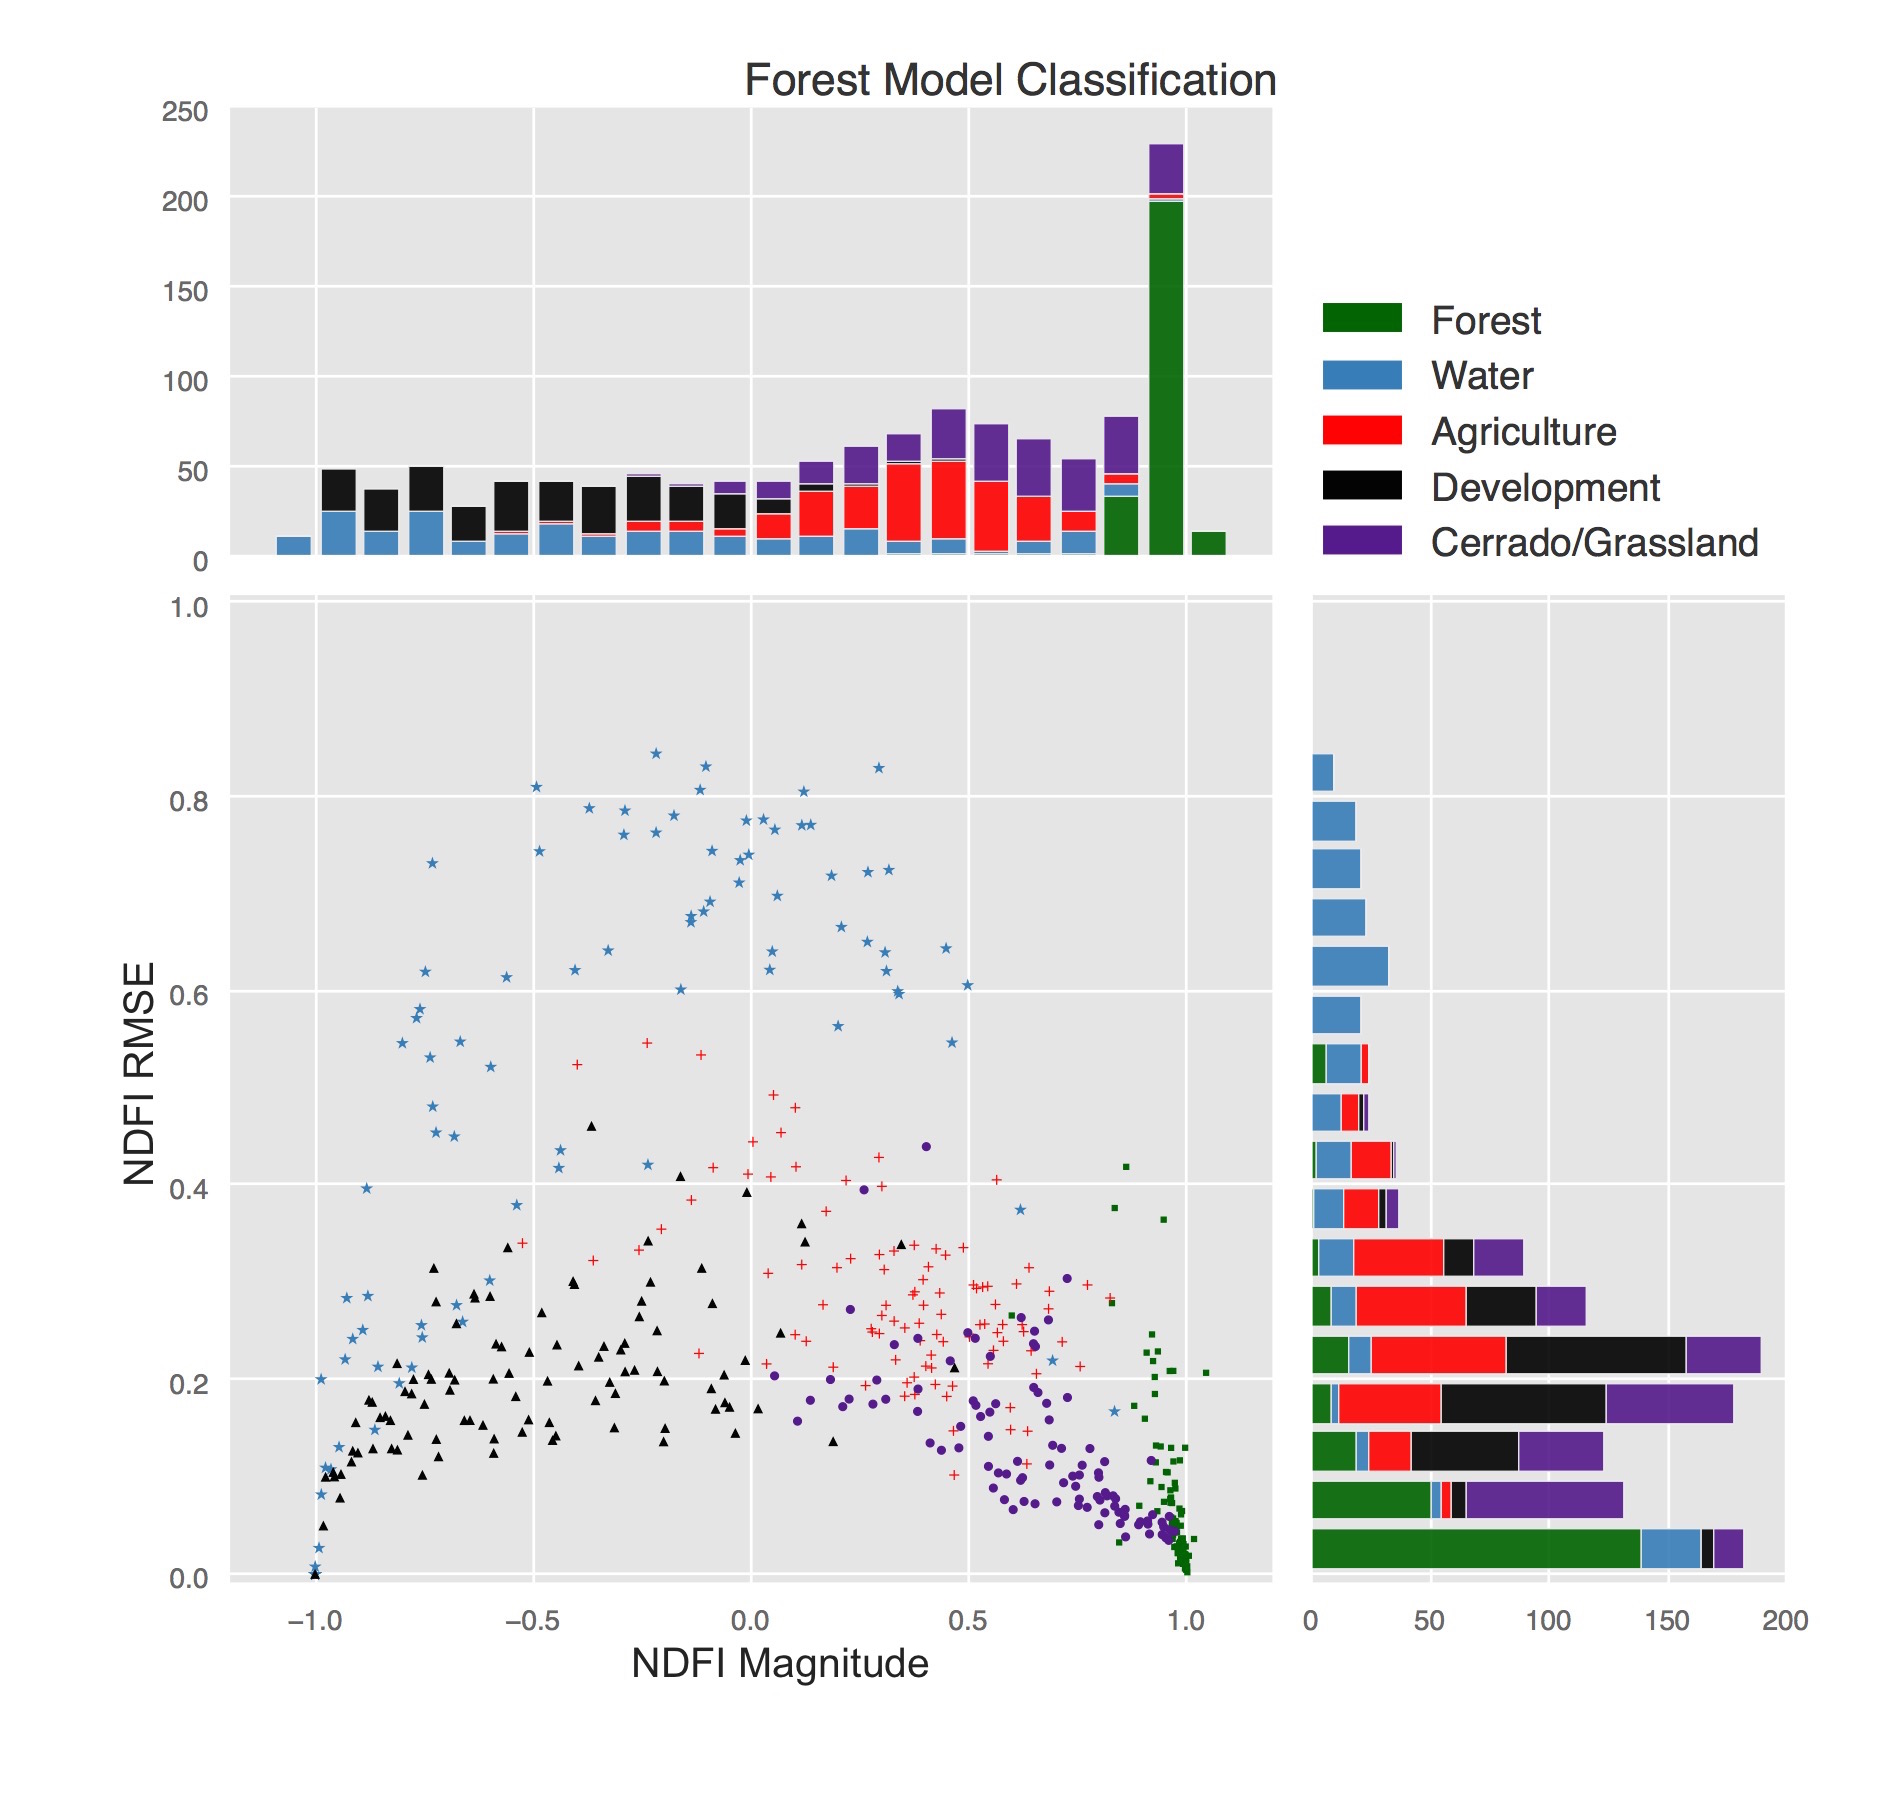
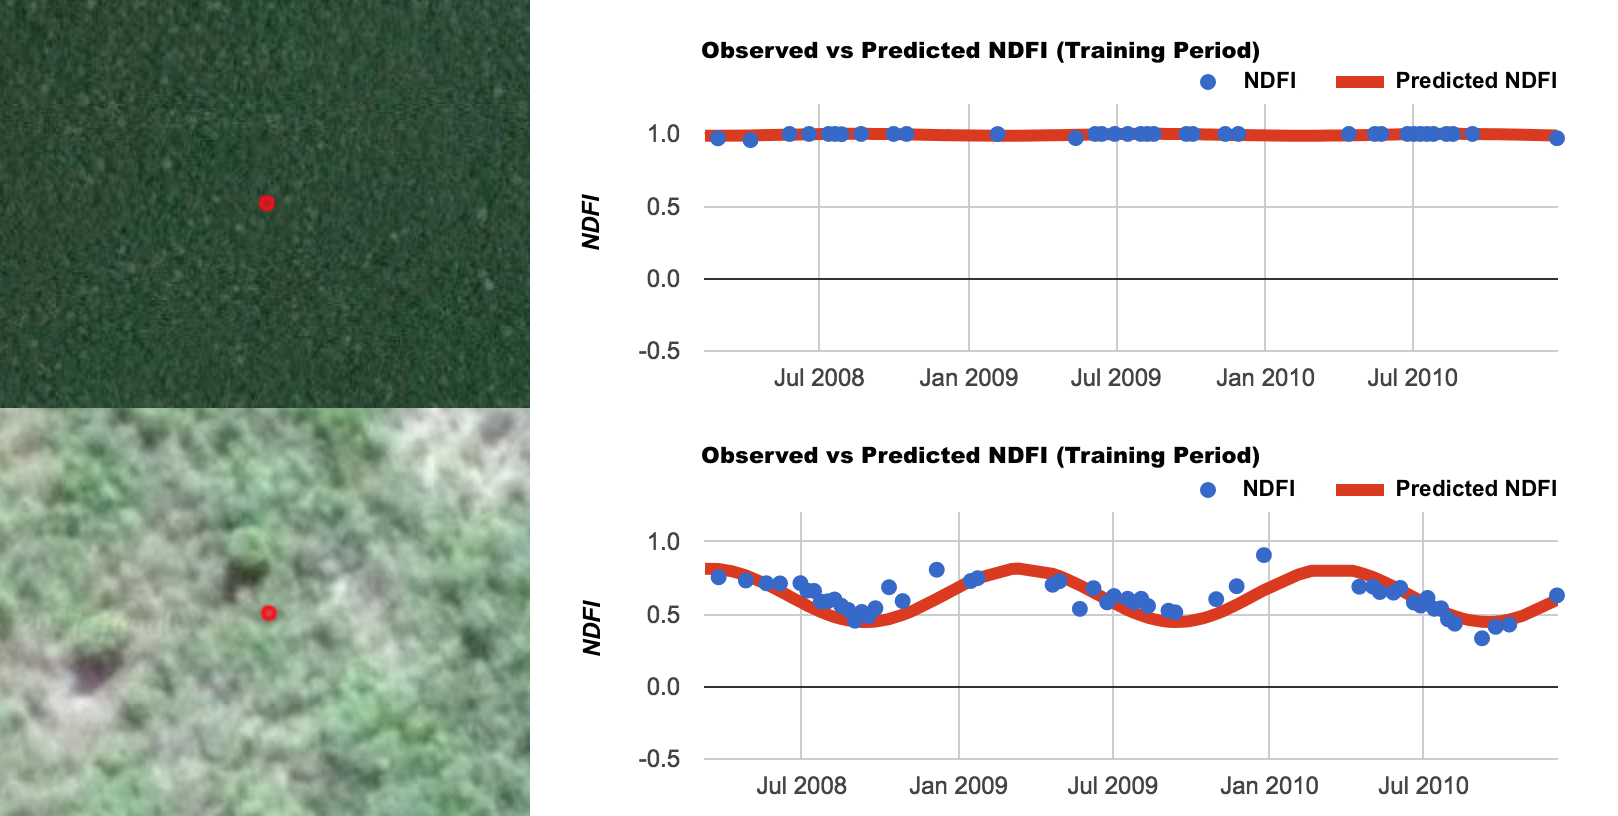
An important step in this process is not just forest classification, but forest characterization. By calculating the training NDFI regression magnitude, change in NDFI can then be calculated relative to original condition. In this manner, degradation is defined as its relation to original state, not just the NDFI at the current time. A good example of this distinction is in forested cerrado, which exists naturally in a state of non-continuous canopy cover. The cerrado will naturally have a lower NDFI than a closed-canopy forest, but that does not mean it is degraded. This difference alludes to the difficulty in classifying a degraded forest based on a single image alone.
To see the difference in forest characterization with canopy cover, see the difference in NDFI between a dense congruent canopy in Rondônia (top), and a thinner forested cerrado in Mato Grosso (bottom, images courtesy Google Earth):
Change detection
The change detection is performed by using the regression coefficients to predict future NDFI observations. In this way the algorithm is being performed online, meaning that change is monitored for sequentially in time. If new NDFI observations deviate beyond a change threshold for 5 consecutive observations, a disturbance is detected. The change threshold is effectively a control on the maximum allowable residual in a ‘stable’ time series.
Versions
Version history of CODED
There are now three versions of CODED that will produce similar but not identical results:
- Version 0 is the original beta implementation, written entirely in Javascript using the Google Earth Engine API. This version is what is described in the paper.
- Version 1 was created to overcome technical limitations of Version 0. Put simply, Version 0 was not efficient enough to consistently run over large areas. Version 1 makes use of the GEE CCDC implementation for change monitoring, adapted to create the algorithm described in the CODED paper. Version 1 is what is implemented in the Forest Disturbance Mapping GUI.
- Version 2 is nearly identical to Version 1 but makes use of the CODED API. Version 2 is the most recent version and will be the only version modified moving forward. This version is what is applied in the Javascript tutorial. The main difference between Version 1 and 2 is that version 2 has more options for output layers.
Tutorial (Javascript)
Running CODED using the Javascript API
This tutorial is currently (as of 2-2-2022) under construction.
Running CODED using a Javascript template
A template for running the change detection for CODED Version 2 is found in the coded repo in the file ‘Templates/Change Detection Template’. The repo must be added on Google Earth Engine by following this link. To run CODED, you must define the parameters below, click ‘Run’, and submit the export Tasks.
Parameters for defining the study area
| Parameter | Type | Description |
|---|---|---|
| countryStudyArea | boolean | Use a country boundary for the study area |
| country | string | Name of country to use as study area |
| studyArea | string | Asset to use if countryStudyArea is false |
Note: studyArea will be ignored if countryStudyArea is true.
Parameters for filtering the input Landsat data
| Parameter | Type | Description |
|---|---|---|
| startDoy | integer | Start day of year |
| endDoy | integer | End day of year |
| startYear | integer | Start year |
| endYear | integer | End year |
Parameters for defining a forest mask
| Parameter | Type | Description |
|---|---|---|
| useMask | boolean | Whether or not to apply a forest mask |
| getMaskFromHansen | boolean | Whether or not to generate a forest mask from UMD dataset |
| forestMask | string | Path to asset if using mask and not from UMD |
| focalMode | integer | Focal mode window size to apply to mask |
| treeCoverThreshold | integer | Tree cover threshold for UMD dataset |
Note: All parameters will be ignored if useMask is false. getMaskFromHansen, focalMode, and treeCoverThreshold will be ignored if forestMask is defined.
Parameters for defining training data
| Parameter | Type | Description |
|---|---|---|
| getTrainingFromHansen | boolean | Whether or not to sample the UMD dataset for training data |
| training | string | Path to feature collection with training data |
| prepTraining | boolean | Whether or not to cache predictor data and export asset |
| forestValue | number | The number associated with forest points |
| numberOfPoints | number | Number of points to sample from UMD layer |
Note: training will be ignored if getTrainingFromHansen is true. numberOfPoints will be ignored if getTrainingFromHansen is false. The first time running CODED, prepTraining must be true.
Parameters for CODED change detection
| Parameter | Type | Description |
|---|---|---|
| minObservations | integer | # of consecutive observations to flag a change |
| chiSquareProbability | float | Threshold that controls sensitivity to change |
Parameters for exporting and saving results
| Parameter | Type | Description |
|---|---|---|
| outName | string | Output asset ID |
| numberOfChangesToExport | integer | # of disturbances to keep in output dataset |
| dateInt | boolean | Standardized dates to be 8 bit integers |
| maskProb | boolean | Mask changes that do not have a change probability of 1 |
| flipMag | boolean | Make NDFI change magnitude positive |
| exportLayers | object | Layers to export in image stack |
Note: dateInt will convert dates so that the date = date - startYear + 1.
Parameters for exporting the results in grid cells
| Parameter | Type | Description |
|---|---|---|
| exportInGrids | boolean | Whether or not to split output into multiple tasks |
| gridFolder | string | Path to folder to save gridded results |
| gridSize | number | Length of grid edge in degrees |
| gridPrefix | string | Prefix for name to output grid assets |
| gridMin | number | Index of first grid to export |
| gridMax | number | Index of last grid to export |
| predefinedGrid | string | Path to feature collection with predefined grid |
Note: All grid parameters will be ignored and the results will be exported in a single task if exportInGrids is false.
Tutorial (GUI)
Please refer to the following resources for further background information and tutorials for running CODED:
- OpenMRV: An open-source resource for Forest Measurement, Reporting, and Verification (MRV). One Module in OpenMRV is CODED, with detailed background information, parameter descriptions, and examples using Javascript and a graphical user interface.
- E-Learning: An interactive course on CODED narrated by Dr. Eric Bullock.