Estimating Area of Deforestation and Degradation using AREA2 and CODED

By Eric Bullock (bullocke@bu.edu)
Part 1: Running CODED
1.1 The Disturbance Dataset
A tutorial on running CODED using the Javascript interface can be found here. This process can be easily facilitated using the user interface provided in the CODED repository in ‘coded/apps/Submit CODED UI’.
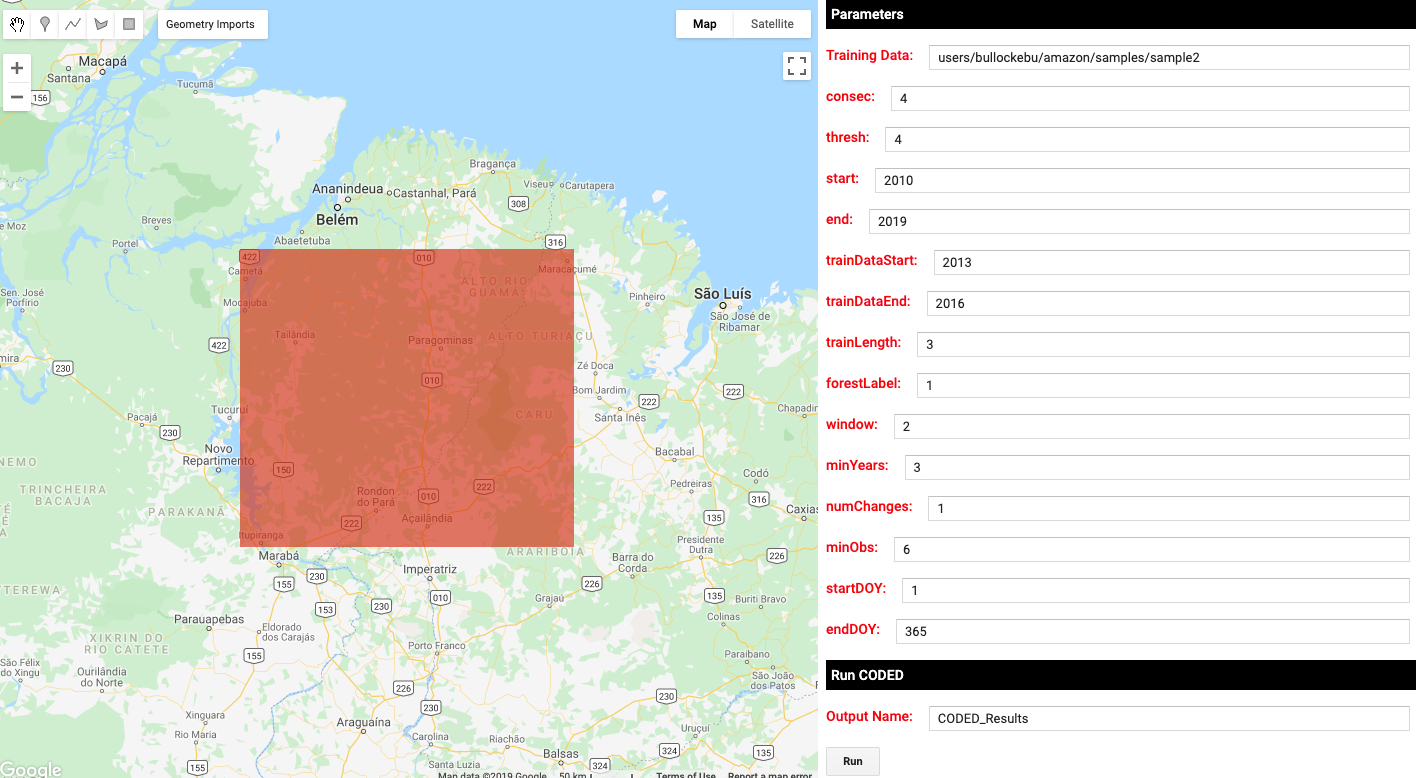
The parameters used for this tutorial are shown in the image above, and a task for running CODED can be submitted by clicking the ‘Run’ button. The study region can be defined by drawing a square polygon in the ‘region’ geometry import. Note that this must be a single polygon, and must be contained in the ‘region’ geometry.
The training data used in this analysis can be found in the feature collection: ‘users/bullockebu/amazon/samples/sample2’
1.2 Stratification
In cases in which the classes of interest are small relative to the study region it is generally recommended to use a stratified random sample design. A simple random sample is technically possible but would be less efficient. For this exercise we are assuming that the class of interest is degradation, which is often small in area compared to stable land covers. Therefore, we will be using a stratified random design for sampling and estimation.
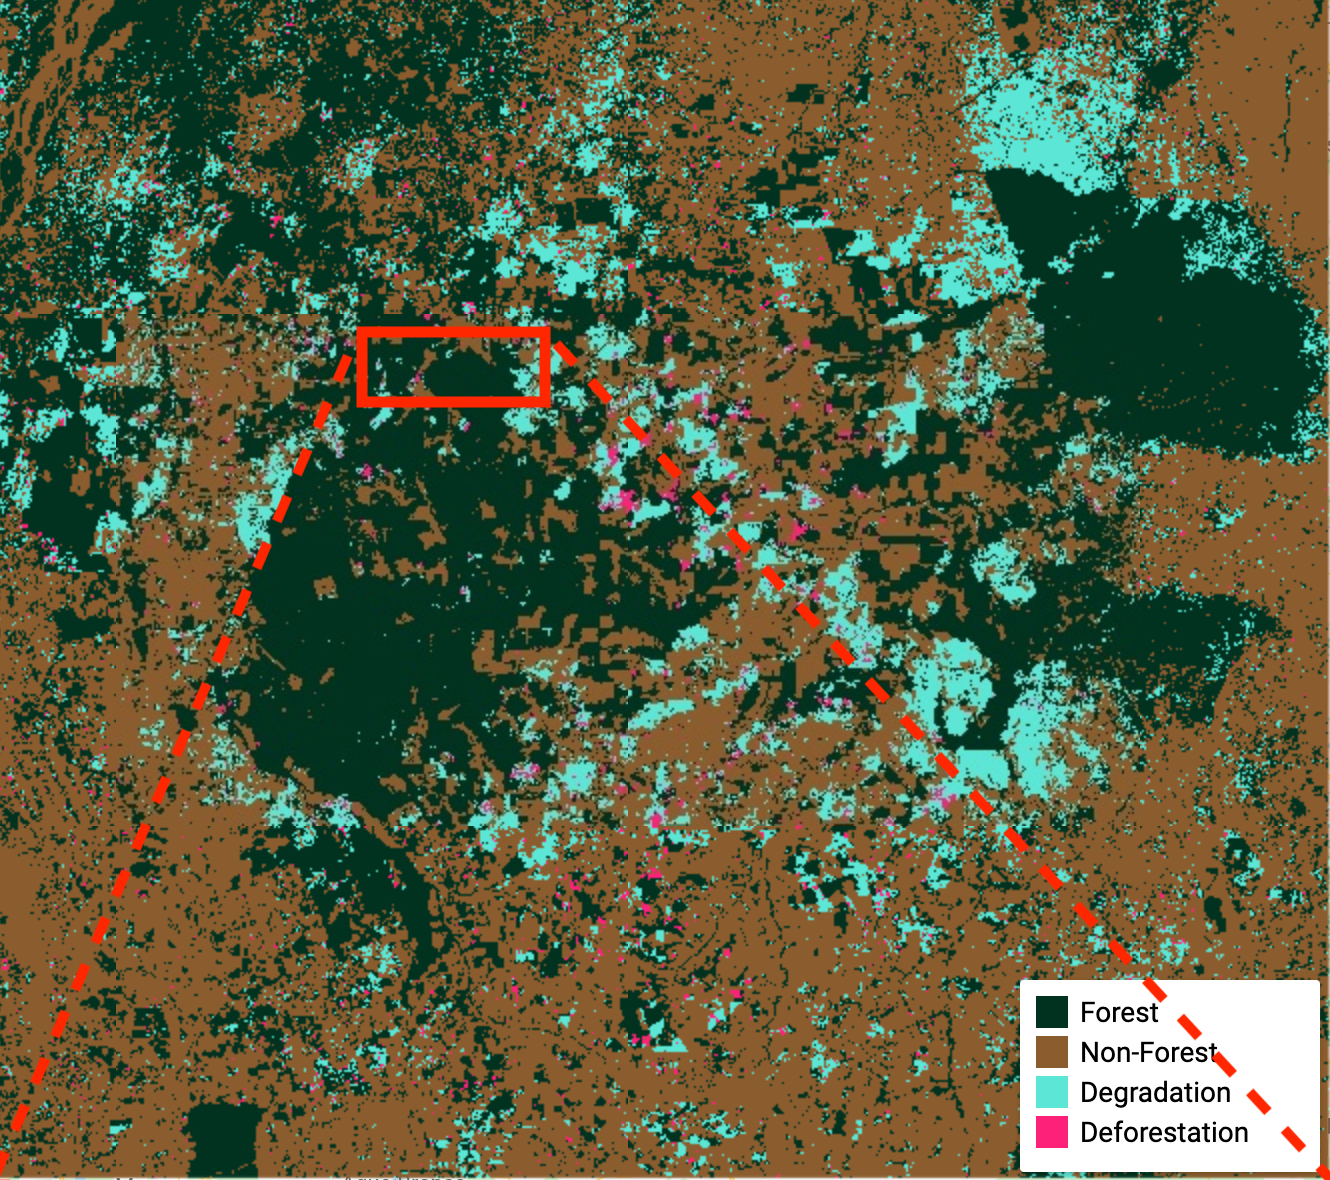
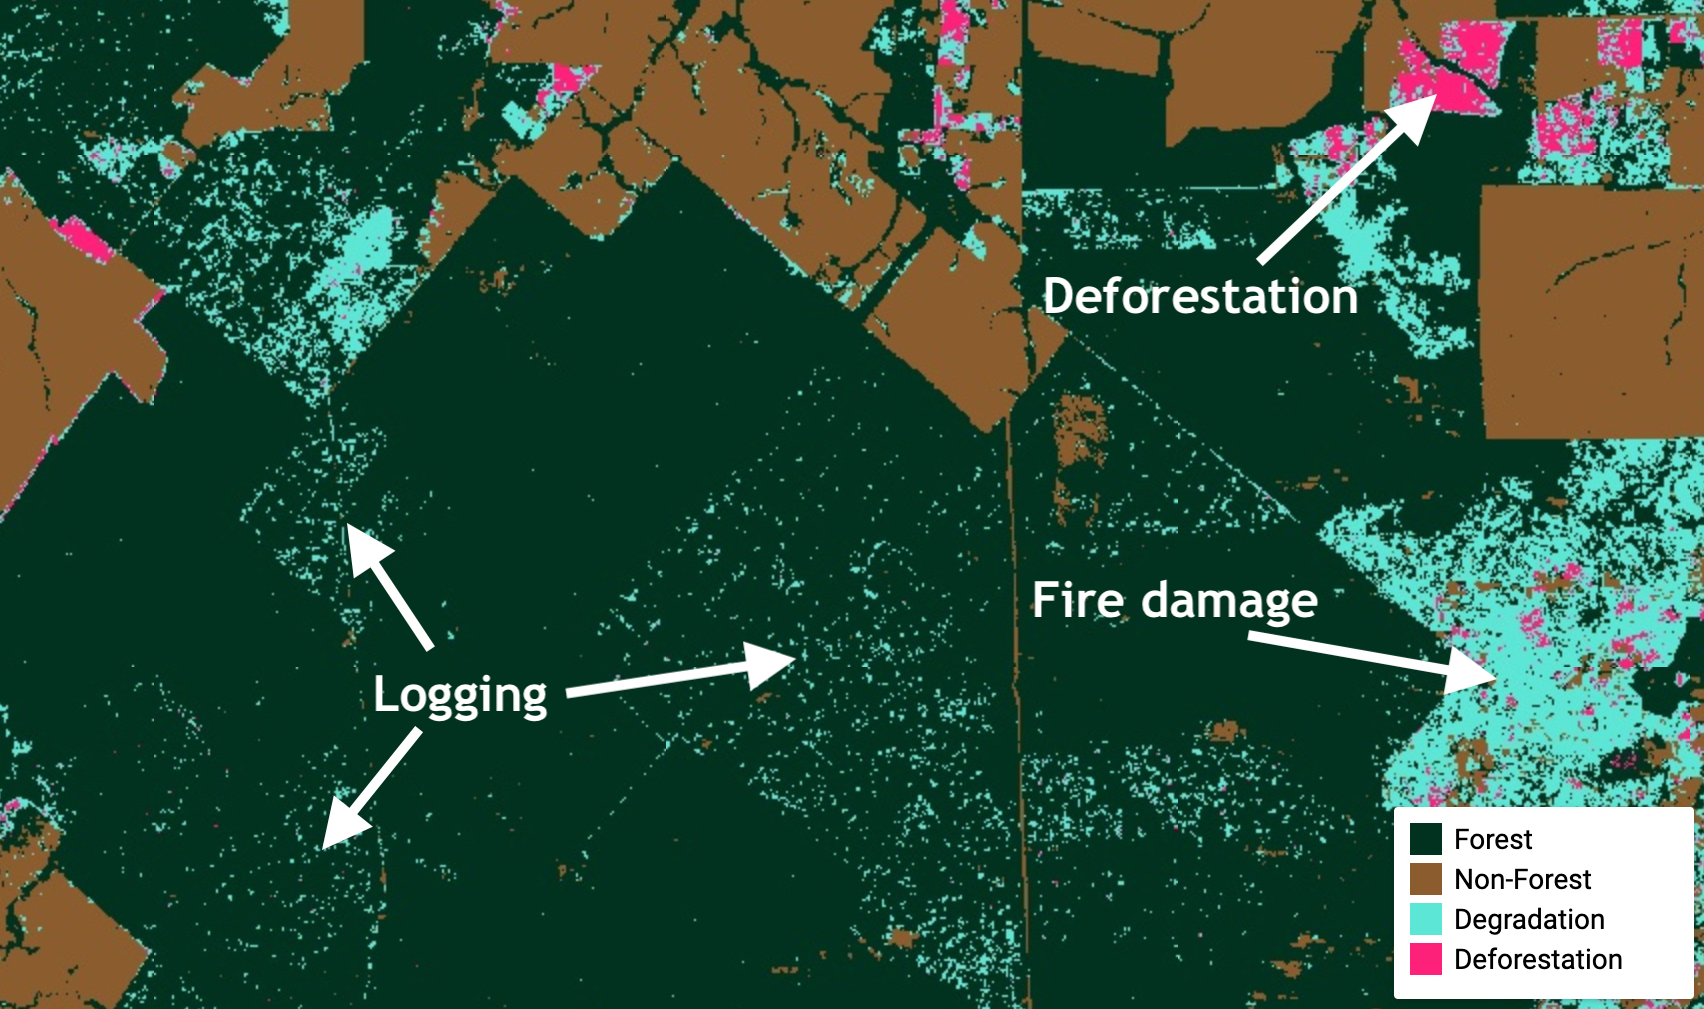
The only input needed for this tutorial is a strata map. In our case the strata are Forest, Non-Forest, Deforestation, and Degradation. The population consists of the pixels in the map, and we will use reference observations to estimate the proportions of the population that are from our four classes.
Note that this map should be treated as a stratification: a simple map made with little care for resolving errors and for the primary purpose for stratifying a sample. The CODED results can be turned into a stratification using a few simple heuristic rules for defining the classes. The forest and non-forest classes are the land cover classification of areas without a forest disturbance.
// The results are masked in areas of non change, so first unmask
var unmasked = image.unmask()

// Get each stratum and assign correct label
var forest = unmasked.select('forest_2010').eq(1)
  .and(unmasked.select('dist_1').eq(0))

var nonForest = unmasked.select('forest_2010').neq(1)
  .and(unmasked.select('dist_1').eq(0)).remap([1],[2])
Some areas do not have enough observations after the disturbance to classify as forest/non-forest and therefore do not have a disturbance type. We can either ignore these pixels or use a threshold on the change magnitude as a proxy for deforestation. Here we will use a threshold of 20 to do differentiate degradation and deforestation.
var magThreshold = 20

var degradation = unmasked.select('post_1').eq(1)
  .or(unmasked.select('mag_1').lte(magThreshold))
  .remap([1],[3])

var deforestation = unmasked.select('post_1').gt(1)
  .or(unmasked.select('mag_1').gt(magThreshold))
  .remap([1],[4])

// Combine the strata into a single band image
var strata = ee.Image.cat([forest,nonForest,degradation,deforestation])
  .selfMask()
  .reduce(ee.Reducer.firstNonNull())

// Create an image palette and add to display
var imagePalette = ['#013220', '#8b5d2e', '#5CE5D5','#FF2079']
var strata = ee.Image('projects/AREA2/bullocke/amazon/Amazon_Example_Strata')
Map.addLayer(strata, {min: 1, max: 4, palette: imagePalette}, 'Stratification')